Patternholic
Industry
Telecommunications
Client
York Uni School Project
Service
Data Visualization
Date
2013


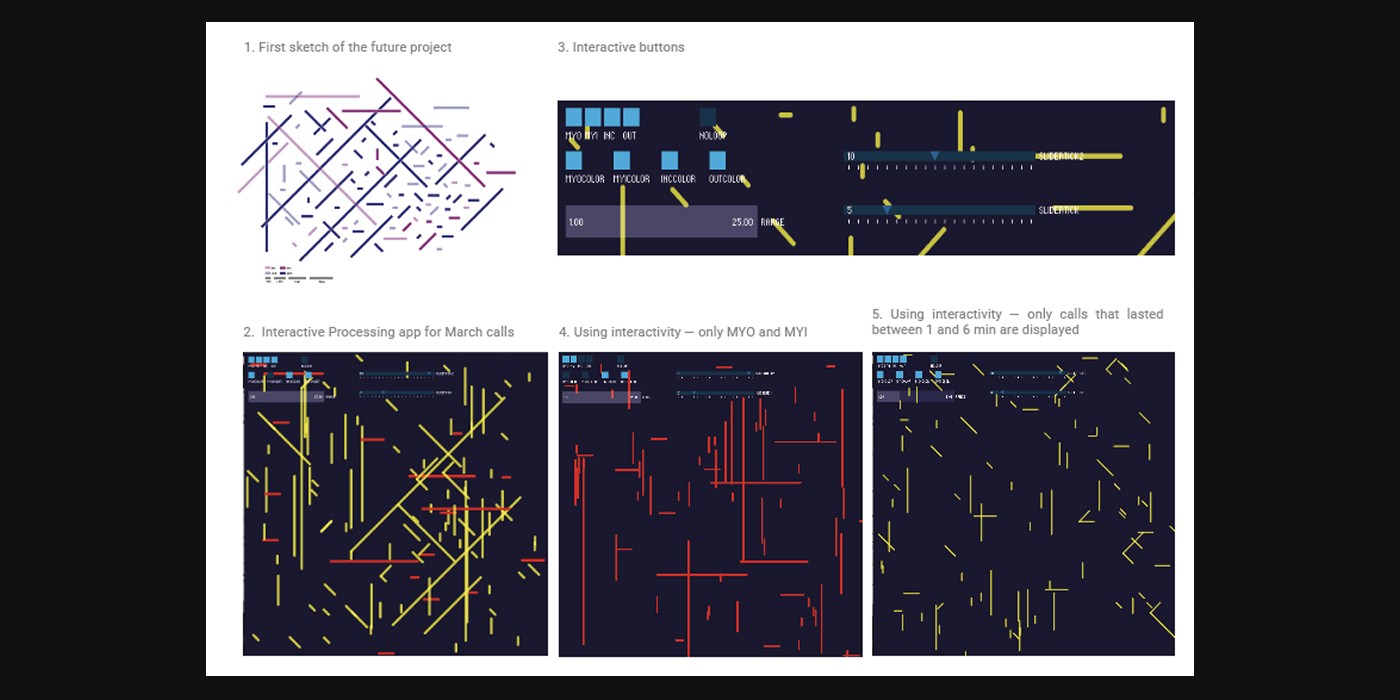
Patternholic Processing app was made to visualize phone call data from an anonymous user in Ontario, Canada. I was provided raw data for a year of phone calls, along with information on which date where they made, at what time, where was the call made from, what number and location where called, how long did it last and what call type (myo, out, inc, myi) and tariffe was used (day time/night time/ weekend time). My task was to take a data driven approach and therefore create visualization that does not put user but data in the first plan.
How the graphs were created: